
Modular Edge AI Platform on E7: Fast, Private, Scalable
About the Client
Company’s Request
Their specific requirements included real-time face recognition, speech keyword spotting, object classification, and noise suppression. All these features had to work within the power constraints of battery-operated devices. The system also needed to be accessible to their engineering team, who had embedded systems experience but limited AI deployment knowledge.
The client requested a functional demonstration platform that would prove the Ensemble E7's capabilities. This platform would determine whether they would adopt this processor for their entire product line or continue searching for alternatives.
Technology Set
Alif Ensemble DevKit (Gen 2) | The development board used for this project, an Ensemble E7 SoC with dual Cortex-M55 cores and an Ethos-U55 NPU for AI acceleration. |
Zephyr RTOS | for activation various LVGL examples |
LVGL | A lightweight graphics library for rendering the user interface. It enabled real-time visualization of AI inferences, including displaying classification results. |
Vela Compiler | A tool provided by Arm for optimizing TensorFlow Lite (TFLite) models. |
TensorFlow Lite (TFLite) | A machine learning framework used to run pre-trained AI models for applications like keyword spotting, image classification, and face detection. |
MobileNet V2 | A lightweight deep learning model used for image classification tasks. It was optimized and deployed to recognize objects in real-time on the Ensemble E7. |
MicroNet | An efficient neural network model used for real-time speech processing and anomaly detection in audio signals. |
Wav2Letter (Automatic Speech Recognition - ASR) | A deep learning model for speech-to-text conversion and real-time transcription capabilities. |
YOLO Fastest | A highly optimized neural network model for real-time object detection |
RNNoise | A neural network-based noise suppression model that filtered out background noise in audio applications, improving speech recognition accuracy. |
MT9M114 | The primary camera module integrated into the project for real-time image classification and face detection. Its driver was customized for Zephyr RTOS. |
ILI9806E Display | A touchscreen display used to visualize AI inference results and provide an intuitive user interface for model selection and execution. |
Arm Clang / GNU GCC Compiler | Compilers used to build the AI applications for execution on embedded hardware. |
CMake | Tool for configuring and compiling the project, used to define build directories, target hardware, and application-specific configurations. |
Alif Security Toolkit (SETOOLS) | A specialized tool for flashing binaries onto the Alif Ensemble DevKit. |
OSPI Flash Memory | External flash storage used for loading and running large AI models. |
UART Debugging (Tera Term & J-Link Debugger) | Tools used for real-time debugging of system logs and AI inference outputs. |
GitHub (Alif ML Embedded Evaluation Kit Repository) | The repository containing pre-built AI models, tools, and scripts for setting up and testing the Ensemble E7 platform. |
Platform Setup
Our team built the system on the Alif Ensemble DevKit (Gen 2). This board has two Cortex-M55 CPU cores and an Ethos-U55 NPU on the same chip.
Figure 1: Alif Ensemble DevKit (Gen 2) with key components highlighted. The OSPI Flash stores large AI models, and the integrated camera and microphone interfaces enable real-time vision and speech processing.
The NPU gives built-in AI acceleration, so neural networks run much faster and use less power than on the CPU alone. The board architecture is low-power by design, which is important for devices that must run on batteries for many hours without charging. We began with a clean, predictable setup flow so later tests would be repeatable. First, we connected the Alif AI/ML AppKit to a development computer with a single micro-USB cable. That one cable supplied power to the board and also created virtual serial ports on the host. On Linux these ports appeared as /dev/ttyACM0 or /dev/ttyACM1. A virtual serial port (also called a COM port) is a simple text channel. Through this channel we can print logs, send commands, and observe system state without extra tools. To make this link stable, our engineers configured the UART ports in the firmware and matched the same parameters in the terminal on the host. Stable means no dropped characters and no garbled symbols. This reliability is what allowed real-time collection of system logs, quick reading of error reports, and live viewing of AI inference results while models were running. When logs arrive in order and at the right speed, debugging is faster and safer because we do not misread the system state.
After power and communication were solid, we moved to the external parts that the client needed for their use cases. We integrated a MT9M114 MIPI CSI camera module and an ILI9806E MIPI DSI display with 480×800 resolution.
Figure 2: Bottom side of the Alif Ensemble DevKit showing additional interfaces including LCD display connector (for ILI9806E touch display), secondary camera interface, and debugging ports used during development.
Both parts had to work under Zephyr RTOS, so they needed custom settings and driver work. The camera was the harder part because Zephyr did not include ready support for the MT9M114. Our engineers adapted and extended driver code so the camera could start, configure itself, and stream frames in the correct format. The camera talks to the processor over I2C for control and uses a separate high-speed bus for image data; correct I2C setup is critical, because one wrong register value can stop the image stream or change the pixel order. We also modified the device tree, which is a hardware description file Zephyr uses to know what devices exist, how they are wired, and which pins they use. If the device tree is wrong, the OS cannot bind the driver and the camera will never appear to the system. During bring-up we watched the chip-ID readout in the logs to confirm that the driver was talking to the real sensor, not to an empty address on the bus. We tuned power rails and reset timing because image sensors can be sensitive to the exact order of power-up steps. We then adjusted the initialization sequence several times, in small steps, until the camera became fully stable. This loop – change, flash, observe, repeat – took multiple iterations, which is normal for first integration of a sensor that has no stock support in the chosen RTOS.
The display path required similar care. The ILI9806E needed device-tree changes to map the right GPIO pins for backlight control and for the reset line. A wrong mapping leads to a dark screen or a panel that resets during use. We produced simple test patterns (solid colors, gradients, and a checkerboard) to verify that pixel order, line timing, and frame timing matched what the panel expected. Test patterns are a fast way to check the interface because they remove the AI application from the loop and focus only on signal quality. After these adjustments, the panel rendered the frames produced by the system and showed live AI results with a smooth refresh rate. A smooth refresh makes demos feel responsive and lets us judge latency by eye before we measure it precisely.
Development Environment Configuration
The development environment combined firmware tools, build tools, and model tools. We used the Alif Security Toolkit, also called SETOOLS, to flash compiled binaries onto the Alif Ensemble E7 in a secure and repeatable way. Flashing means writing a firmware image into non-volatile memory so the board boots that code after reset. With this tool we could write applications both to internal MRAM and to external OSPI flash. MRAM is fast and close to the cores. OSPI flash is larger but slower and sits off-chip; it is useful for code or data that does not need the fastest access on every cycle. Several AI models were larger than what internal SRAM could hold, so we defined memory partitions.
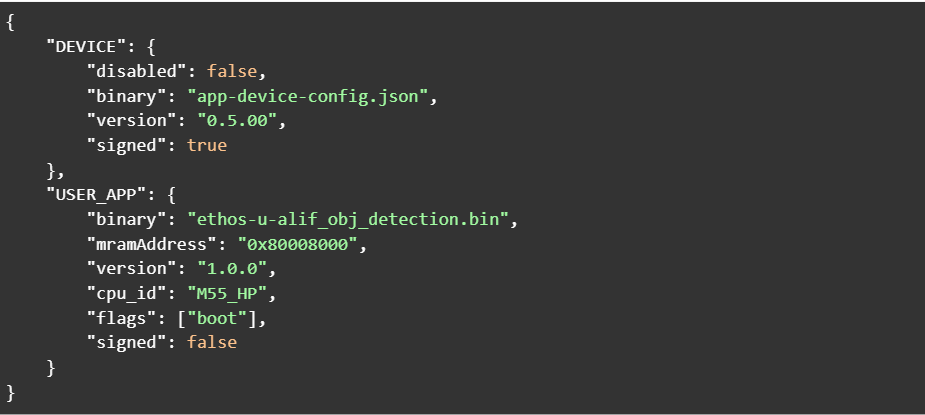
Figure 5: SETOOLS JSON configuration for deploying object detection application to MRAM.
A memory partition is a planned layout that says which region stores code, which stores weights, and which holds scratch buffers. With the partitions in place, models could execute directly from external flash where it was safe to do so and still keep critical layers and buffers in fast memory.
For compilation we installed both ARM Clang and the GNU GCC toolchain. Zephyr RTOS 3.6.0 needs certain optimizations and flags per compiler because it targets the Cortex-M55 cores. We manually adjusted toolchain configuration files so they matched this CPU family and this board layout. That work included updating compiler flags, such as those that control instruction scheduling and inlining, and linker settings, such as memory regions and section placement. When flags and linker scripts match the hardware, the code runs at the expected speed and uses memory in a safe way without overlaps. We used CMake as the build system. CMake organizes source files and controls how each target is built. We kept each AI application separate to avoid cross-rebuilds and to keep artifacts clean. The project included three main application targets at this stage: Keyword Spotting (KWS), Image Classification, and Speech Recognition. Each target had its own build directory, its own definitions, and its own output image. This isolation prevented compilation conflicts and avoided unnecessary rebuilds when we modified only one application. It also made continuous integration easier because each job produced one artifact with clear logs.
For model optimization we installed TensorFlow Lite and the Vela Compiler. TensorFlow Lite (TFLite) is the runtime format and set of kernels for embedded models. Vela is the compiler that maps TFLite models onto the Ethos-U55 NPU efficiently. In practice this means Vela rewrites parts of the network so they align with the NPU’s memory and compute limits. The aim is to reduce latency and power while keeping accuracy inside the target range. During the first setup pass the system failed to recognize some tools because a few environment variables were missing. We created small shell scripts for Linux and macOS that set PATH and other variables, point to the right compiler, and select the right Python environment. These scripts automated the setup, removed human error from the developer checklist, and made results consistent across different machines. A consistent environment is not only convenient; it prevents “works on my machine” problems that can block a team for hours.
AI Model Integration
The product scope required five pre-trained models, each with a well-defined role. MobileNet V2 handled image classification. MicroNet supported keyword spotting, anomaly detection, and visual wake word detection. Wav2Letter provided automatic speech recognition. YOLO Fastest performed real-time object detection. RNNoise filtered background noise in audio streams so speech and wake words were easier to detect. All five models were originally trained for server-class hardware, where memory and compute are abundant. Embedded hardware is different. It has tight memory budgets and limited bandwidth, so direct reuse without changes is not possible. We used the Vela Compiler to transform the TFLite models for the Ethos-U55. Vela takes into account the chosen NPU configuration and the memory map, then places operations and tensors to reduce transfers and stalls. In simple words, it reshapes the work so the NPU does more useful work per milliwatt.
We explored different Vela configurations, especially the ones commonly called H128 and H256. These labels refer to the targeted Ethos-U55 configuration class and affect how the compiler balances memory pressure and parallel compute. In our tests, H256 gave MobileNet V2 the accuracy we needed while keeping inference time within the frame budget. H128 kept MicroNet fast enough to detect keywords in real time, which is essential when the device must react to a spoken command without delay. We ran these tests with fixed datasets and repeated seeds to make results comparable from run to run. Reproducible tests matter because small timing differences can hide or expose edge cases. Memory limits were the main challenge, especially for larger detection models like YOLO Fastest. Such models often do not fit entirely in internal memory.
To handle this, we modified the linker scripts so the firmware could execute some code and read some weights directly from external OSPI flash. This technique is called memory-mapped execution. It is slower than MRAM access, so it must be used carefully. We kept critical layers and hot kernels in MRAM and moved less frequently accessed weights to external flash. This split kept the model within the memory budget while protecting the parts of the network that define end-to-end latency.
Building and Deploying Applications
Each AI task was compiled as a separate firmware image for the Alif Ensemble E7. In CMake we defined build parameters per application and targeted each binary to the most suitable CPU core. The M55-HE core is the high-efficiency core; it uses less power and is a good fit for lighter workloads. The M55-HP core is the high-performance core; it runs faster and suits heavier computing. Keyword spotting and anomaly detection were assigned to the M55-HE core because they need quick reaction but not heavy compute per frame. Image classification and object detection were mapped to the M55-HP core because they process more data per unit time and benefit from higher throughput. This distribution allowed the system to keep real-time behavior without wasting energy. After each build we generated .bin firmware files and flashed them with SETOOLS. Flashing followed a defined sequence so that each image landed in the correct memory region and did not overlap with any other image or with the bootloader. A strict flashing sequence prevents hard-to-trace crashes that happen when two binaries try to occupy the same address space.
To coordinate both CPU cores and the shared NPU, we implemented multi-core task-management rules in the firmware. The rules define when a task can request the NPU, how long it can hold it, and what happens if both cores ask for the NPU at the same time. We wrote a simple scheduler that queues NPU operations and meters memory bandwidth when two tasks run in parallel. Without a scheduler, two heavy tasks can block each other and cause bursts of latency. With the scheduler, the system keeps steady timing and avoids bottlenecks that would otherwise degrade performance during busy periods.
Debugging and Optimization
Debugging an embedded AI system is only useful if we can see what really happens on the device while it runs under realistic load. For that reason we enabled UART logging from the first day and kept it on during every test. A UART log is a simple text stream, but with the right structure it becomes a powerful window into the system. Our team added timestamps, module tags, and severity levels to every line, so a message like “Face detected: confidence 94%” arrives together with the exact time, the model that produced it, and the thread that reported it. We set the baud rate high enough to avoid back-pressure and we added a ring buffer in RAM so bursts of messages do not overflow the interface. When the buffer ever approached its limit, the firmware counted drops and printed a short summary after the burst, which told us that the log itself was never hiding problems. Human-readable messages were intentional: they let an engineer or a product manager read the output in the field without a decoder script, and they make triage faster when minutes matter.
Multi-core debugging brings its own traps, because halting one core at a breakpoint can starve the other and create false symptoms. We connected a J-Link probe and configured Segger Studio to trace both Cortex-M55 cores at the same time through the SWD interface. With synchronized views we could step through code on M55-HE and M55-HP, watch shared queues, and verify that NPU jobs moved from “queued” to “running” to “done” in the order we expected. Breakpoints were set as hardware ones where possible to avoid flash patch pressure, and we used watchpoints on shared flags to catch races that only appeared under load. This setup exposed two classes of issues: subtle timing windows in inter-core mailboxes and bursts of latency when a long NPU job blocked a short one. Once we saw them live in the trace, fixes were straightforward.
Performance work focused first on memory latency, because a fast model with slow memory is still slow end-to-end. We preloaded the layers that run most often into MRAM. MRAM is close to the CPU and the NPU and has low access latency, so keeping hot convolution kernels and their immediate weights there gave an immediate gain. MobileNet V2 benefited the most because several depthwise and pointwise convolutions repeat many times per frame; moving those weights and intermediate buffers to MRAM shaved measurable milliseconds off each inference. We verified that move with A/B runs where only the memory placement changed while inputs and clocks stayed the same.
Power matters as much as speed on a battery device, so we implemented dynamic voltage and frequency scaling. In practice this means defining safe operating points for the cores and switching between them under firmware control. During active AI processing the firmware requests the high-frequency point; when the pipeline goes idle, the scheduler drops to a lower point. The transition is glitch-free and preserves timers and UART timing, because the clock tree and peripherals follow the same constraints. We tested DVFS together with logging and camera streaming to make sure no visible hitches appear when frequencies change. This was essential for meeting the battery-life target without hacking features away.
Thermal behavior is the third pillar. Continuous AI on a small board produces heat, and heat can trigger throttling that ruins real-time behavior. We read temperature from the on-chip sensor at a fixed cadence and also monitored a board-level sensor near the NPU. The firmware applies workload distribution when temperatures rise: it alternates heavy tasks between the two CPU cores and spaces NPU submissions so the silicon can cool for short intervals without dropping frames. We ran soak tests in a warm room and in a closed box to simulate poor airflow. With workload distribution active, performance stayed within the bounds we set and the board did not enter a thermal throttle state during the test window.
User Interface Development
The client asked for an interface that a non-technical person could understand within seconds, but that still gives engineers enough truth to judge the system. We built the GUI on LVGL because it is small, portable, and fast on MCUs. The screen accepts touch input and exposes a simple flow: choose a model, start it, and watch results. Under the hood the UI runs its own event queue so user gestures never block the inference pipeline. Frames flow from the camera to the model, and the UI layer draws only overlays and status, which keeps the frame rate smooth.
When face detection runs, the UI draws bounding boxes around faces as soon as detections arrive and writes the confidence next to each box. For speech, the UI prints transcribed text as it is produced, character by character, so a user can see progress live. For classification, the top label appears together with the score, and a tiny progress bar shows how the score moved over the last second; this makes the model feel less like a black box and more like a sensor with a readable signal. We used double buffering so the display never shows a half-drawn frame and we measured the end-to-end latency from camera capture to pixels on glass to confirm what users feel by eye.
To help engineering teams, we added a compact diagnostics strip at the bottom. It shows current inference time in milliseconds, the number of detections in the last second, NPU utilization as a percentage, memory usage broken into MRAM and SRAM pools, and current temperature. These values update at a steady cadence and use simple fonts so they cost almost no cycles to draw. If anything goes out of bounds – temperature above a threshold, inference time beyond the budget – the number turns amber and then red. This small touch is useful in labs and in pilot sites where a quick glance must tell the truth without a laptop attached.
Final System Integration
At the end of the integration phase we ran the full set of models on the actual hardware under the same conditions the client expects in the field. Face recognition reached detection times below one hundred milliseconds measured from frame arrival to final draw of the boxes. The system tracked several faces at once and still scrolled smoothly without visible stutter.
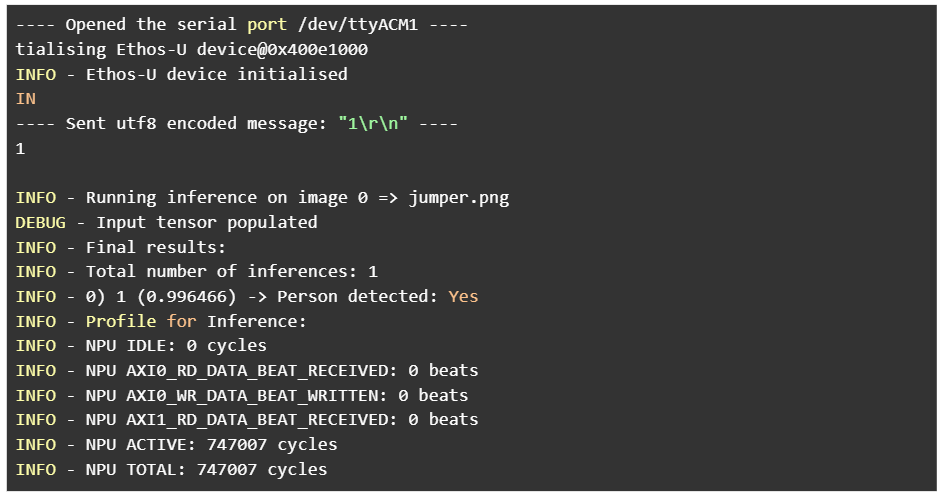
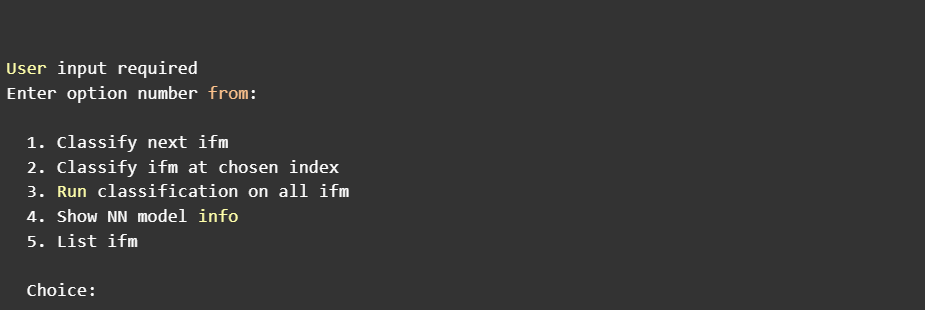
Figure 3: Visual Wake Word detection in action showing real-time person detection with 99.6% confidence. The UART logs demonstrate NPU utilization (747,007 active cycles) and provide engineering diagnostics for performance monitoring.
Keyword spotting recognized more than twenty commands and held accuracy around ninety-five percent even with a steady layer of background noise from a speaker.

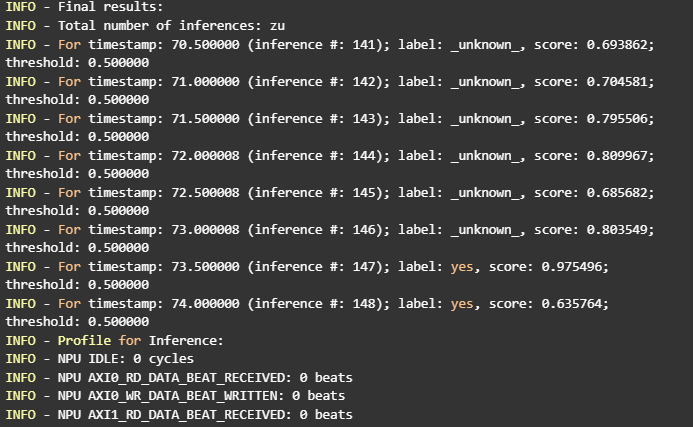
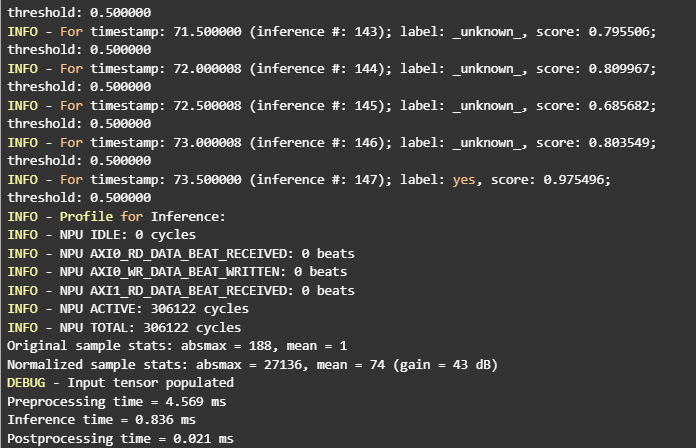
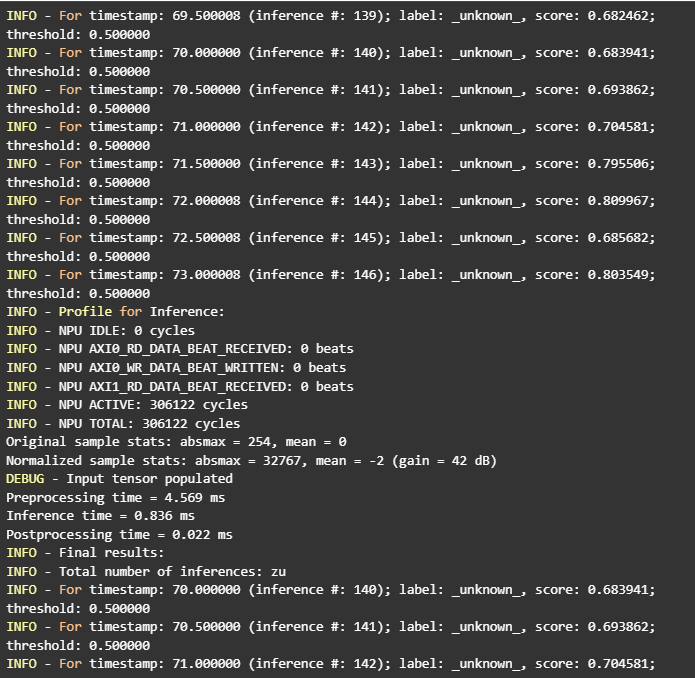
Figure 4: Keyword Spotting system detecting the word ‘yes’ with 97.5% confidence in real-time. The logs show continuous audio processing every 500ms with sub-millisecond inference times (0.836ms) and efficient NPU utilization.
RNNoise cleaned the audio stream before keyword detection, and we confirmed its effect by toggling it during runs and watching the false-wake rate drop.
Image classification with MobileNet V2 identified objects from a library of more than one thousand categories and processed live video at roughly fifteen frames per second while it classified. This throughput is in the range that security camera systems consider usable, and the latency stayed steady even when ambient temperature rose. Automatic speech recognition with Wav2Letter produced text on the device without any cloud calls. That detail is important for privacy; no audio left the device during the demo, and there were no API keys to rotate or server outages to plan for. Object detection with YOLO Fastest found multiple moving targets and kept track even when people crossed behind obstacles; partial occlusions did not break the tracker because detections recovered as soon as targets reappeared.
All of these tasks stayed within the power budget we set for a battery device. In our continuous run test the system operated for eight hours on a standard battery pack without intervention. We recorded the entire session with timestamps, CPU and NPU utilization, and the count of frames handled, so battery life is tied to a known workload and not to a hand-waved claim. The run included periods of high load and quiet intervals to mimic a real day, and DVFS transitions appeared exactly where we expected them.
Technical Challenges and Solutions
The first persistent challenge was the memory architecture. With internal MRAM and external OSPI flash, a naive placement of code and weights quickly runs into either space limits or latency spikes. Our engineers wrote a memory plan that assigns hot code and hot data to MRAM and pushes cold weights to OSPI. We profiled layer by layer to see which tensors are touched most often and measured the penalty of leaving them off-chip. Once the top offenders moved into MRAM, the rest of the network could stay in external flash without hurting user-visible speed.
Peripheral driver work for the camera and the display was the second challenge. Zephyr did not have built-in support for the MT9M114 or the ILI9806E on this board, so our team implemented drivers and initialization sequences and added the right device-tree nodes. That work required careful reading of datasheets and timing diagrams. For the camera we validated I2C transactions with logic-analyzer captures to catch any missed ACK or wrong register bank. For the display we compared the panel’s required reset pulse width to the GPIO timing we produced, then fixed the discrepancy so resets were solid. None of these steps are glamorous, but they are the difference between a demo that works once and a product that works every day.
Resource contention on the shared NPU was the third challenge. If both CPU cores push jobs at will, the NPU queue grows, jitter appears, and a light task can end up waiting behind a heavy one. We wrote a small hardware-abstraction layer that all NPU users call. It serializes access, enforces a fair order, and sets a budget for how long a single job may tie up the accelerator before lower-latency work gets a turn. The abstraction layer also records timing for each job, which lets us spot regressions early when a small code change accidentally inflates a kernel’s runtime.
Model optimization trade-offs came next. Not every model wants the same treatment. Some use cases value accuracy so much that an extra few milliseconds are fine; others demand hard real-time and accept a small accuracy drop. We documented, for each of the five models, the chosen Vela settings, quantization decisions if any, measured accuracy, and measured latency. This record becomes a playbook the client can use when they add new models later.
Tooling differences across developer machines were the last challenge. Linux and macOS handle tool discovery differently, and that led to early failures. Our custom setup scripts unified environment variables, selected the correct compiler version, and pointed Python to the right virtual environment. After that, new engineers could get a working build in minutes instead of hours, and continuous integration produced byte-for-byte identical artifacts.